
The record nobody wanted
The International Energy Agency does not use superlatives lightly. So when its executive director described the Strait of Hormuz closure as the "greatest global energy security challenge in history," traders paid attention. The IEA's formal assessment goes further: this is the "largest supply disruption in the history of the global oil market."
That is not hyperbole. The numbers back it up.
Gulf oil producers have shut in roughly 9.1 million barrels per day in April, according to the U.S. Energy Information Administration. Iraq, Saudi Arabia, Kuwait, the UAE, Qatar, and Bahrain cannot export through their primary route. Add in the collateral damage, including 600,000 bpd of Saudi production knocked offline by Iranian strikes and a 17% reduction in Qatar's LNG capacity after the Ras Laffan attack on March 18, and the total disruption reaches well beyond crude oil alone.
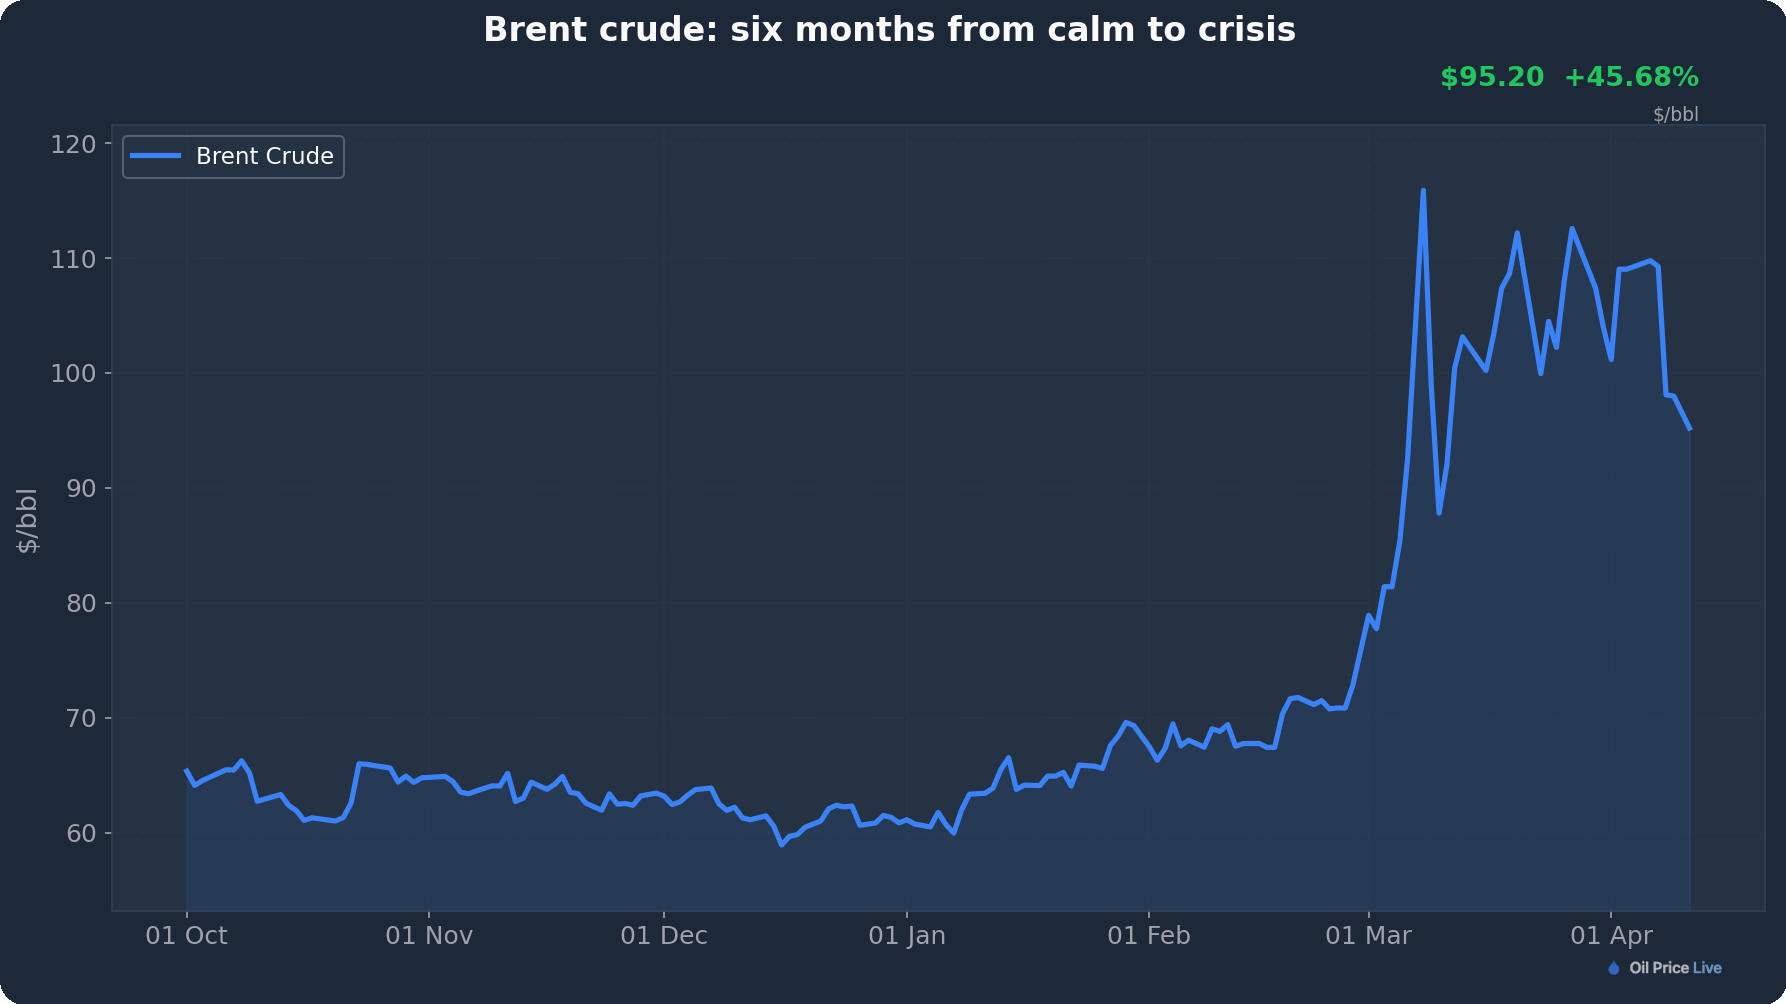
Brent closed the week at $95.20, down from its intraday March peak near $120 but still 31% higher than the $72.48 it fetched on February 28, the day the war started. WTI settled at $96.57.
How it compares to every major oil shock since WWII
| Crisis | Year | Supply lost (bpd) | Share of global supply | Price spike |
|---|---|---|---|---|
| Arab oil embargo | 1973 | 4.5 million | ~7% | +300% |
| Iranian Revolution | 1979 | ~4.8 million | ~7% | +150% |
| Iraq invades Kuwait | 1990 | 4.3 million | ~6% | +90% |
| Libyan civil war | 2011 | 1.5 million | ~1.7% | +25% |
| Iran war / Hormuz closure | 2026 | 9.1 million+ | ~9% | +55% (so far) |
The current disruption removes roughly twice the barrels that the 1973 Arab embargo did. And the 1973 figure, 4.5 million bpd, was enough to trigger a global recession, fuel rationing in the United States, and a permanent restructuring of Western energy policy.
The 2026 crisis is structurally worse in another way. In 1973, OPEC had spare capacity and eventually turned the taps back on. Today, there is almost no spare capacity left. Saudi Arabia, the traditional swing producer, has lost production to strikes and cannot fully utilize its expanded Petroline due to pumping station damage. The usual safety valve does not exist.
Why the price spike looks modest by comparison
If the supply disruption is the largest in history, why hasn't the price spike matched 1973's 300% surge? Three factors explain the gap.
Strategic reserves are being burned. IEA member nations hold roughly 1.2 billion barrels of emergency stocks. The IEA announced coordinated releases in mid-March, and oil began flowing from government stockpiles worldwide by late March. The US Strategic Petroleum Reserve, which held about 410 million barrels before the drawdown, is being tapped alongside reserves in Europe, Japan, and South Korea. That buys time but drains a finite buffer.
Demand destruction is already happening. Airlines have cancelled thousands of flights per day globally. Fuel rationing has spread across more than eight countries. US gasoline hit $4.30 per gallon in some markets, and diesel climbed past $5.60 nationally with California stations above $6. At those levels, consumers and businesses start cutting back, which softens the price impact but damages the real economy.
The ceasefire created a ceiling. Oil crashed 16% on April 8 when the US and Iran agreed to a two-week truce. That single announcement wiped more than $20 off a barrel. Traders are now pricing in some probability that Hormuz reopens, which caps the upside even as the physical market tightens.
The damage that goes beyond barrels
Past oil shocks were about crude. This one reaches further.
Iran's March 18 strike on Qatar's Ras Laffan LNG complex cut 17% of the country's export capacity and sent Asian LNG spot prices up 140%. Helium prices doubled. Fertilizer costs climbed 40% by late March, with nitrogen prices on track to double from 2024 levels.
Gulf states that depend on the Strait of Hormuz for food imports saw 70% of those shipments disrupted by mid-March. Consumer prices in some Gulf countries jumped 40 to 120%. Iranian food inflation hit 105%, with bread and cereal prices up 140% year-over-year.
The European Central Bank has warned that a prolonged conflict will push Germany and Italy into technical recession by year-end. SolAbility estimates global GDP losses ranging from $590 billion if the war ends now to more than $3.5 trillion if it drags on. The UN Development Programme separately put the damage to Arab states alone at $120 billion to $194 billion.
What comes next
The Islamabad talks between VP Vance and Iran's Ghalibaf offer the best chance to reverse the disruption. But even an agreement to reopen Hormuz would take weeks to execute. Mines need clearing. Insurance companies need to lift war-zone exclusions. Tankers need to reroute. Production that has been shut in needs to restart, and some of it will not come back quickly.
The 1973 embargo lasted six months. The 1990 Kuwait disruption took months to unwind, even after the ground war ended in days. The 2026 crisis is already in its sixth week with no clear endpoint.
History has a comparison for every oil shock. It does not have one for this.